
All case studies
vectorstream
Overview

vectorstream is a tool for drawing and editing on web maps. It runs on Leaflet, OpenLayers, and MapLibre and imports and exports shapes as GeoJSON. It stores a border between two areas only once, so a change applies to both areas. The product is a pre-release.
- Type
- Toolkit for drawing and editing on web maps
- Role
- Product, design, and build with AI
Project snapshot
Goal
Developers should be able to add drawing and editing tools to their web map and read every shape back as GeoJSON.
Outcome
vectorstream is a pre-release and has its own product site with features, playground, docs, comparison, and FAQ. The packages @vectorstream/* are not published yet.
AI in use
Built with AI
- I used AI while building it.
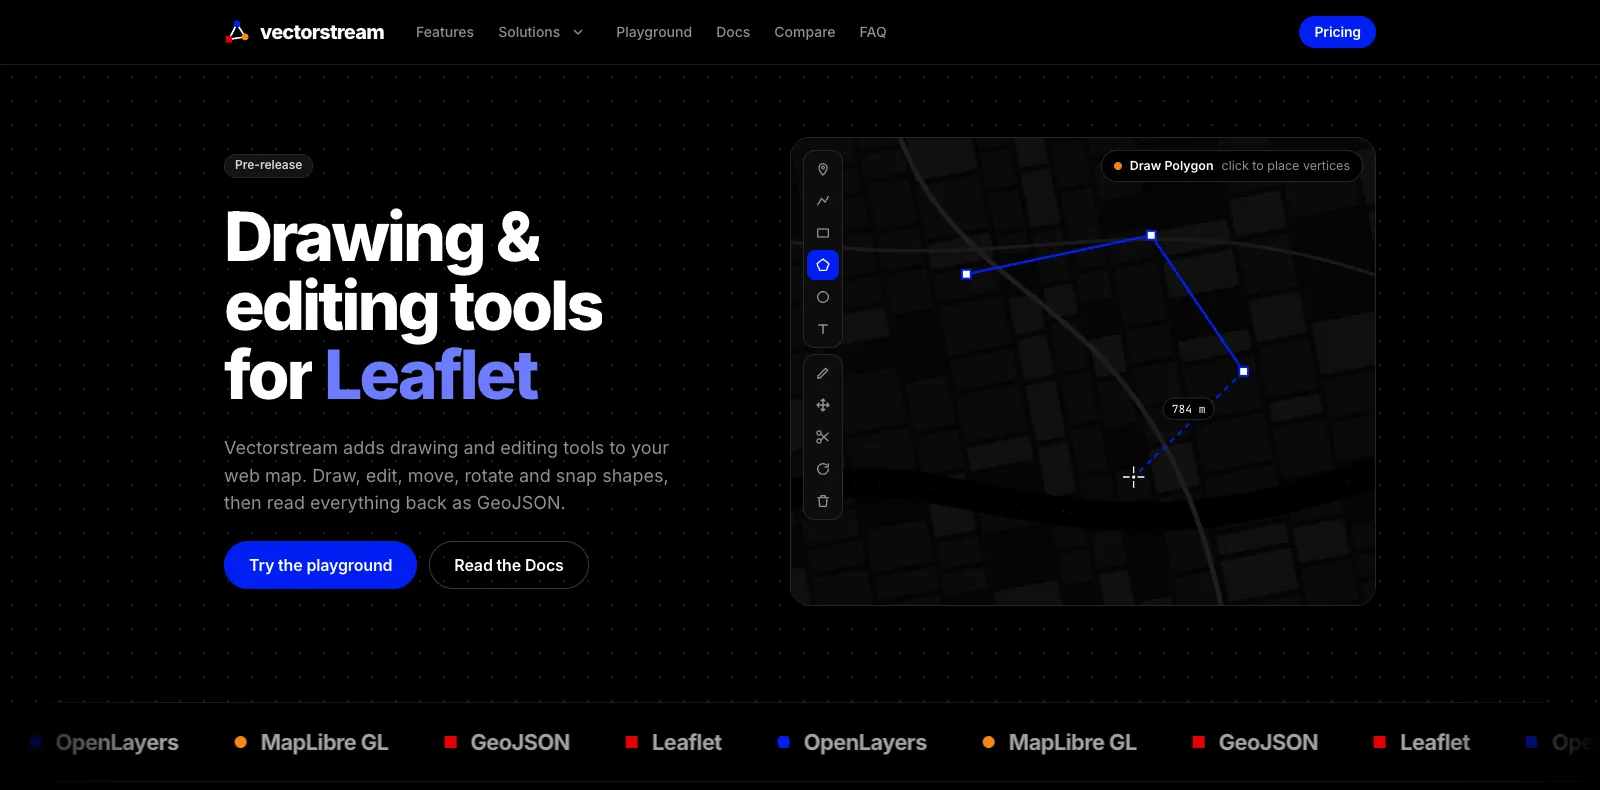
The product
Home page
Editor
Industry page
Features
The functions
- Tools are sorted by task on the features page.
- Drawing covers points, lines, rectangles, polygons, circles, text labels, and freehand areas.
- New points snap onto nearby corners and edges. Because a shared border is stored only once, dragging a shared corner changes both areas.
- Undo returns to the exact previous state.
Playground
The playground
- On the playground page, the real editor runs in the browser.
- Documents stay in the browser: the editor saves them only there and sends nothing to a server. It runs on Leaflet, OpenLayers, or MapLibre GL.
- You can export the drawing as GeoJSON.
Editor
The editor
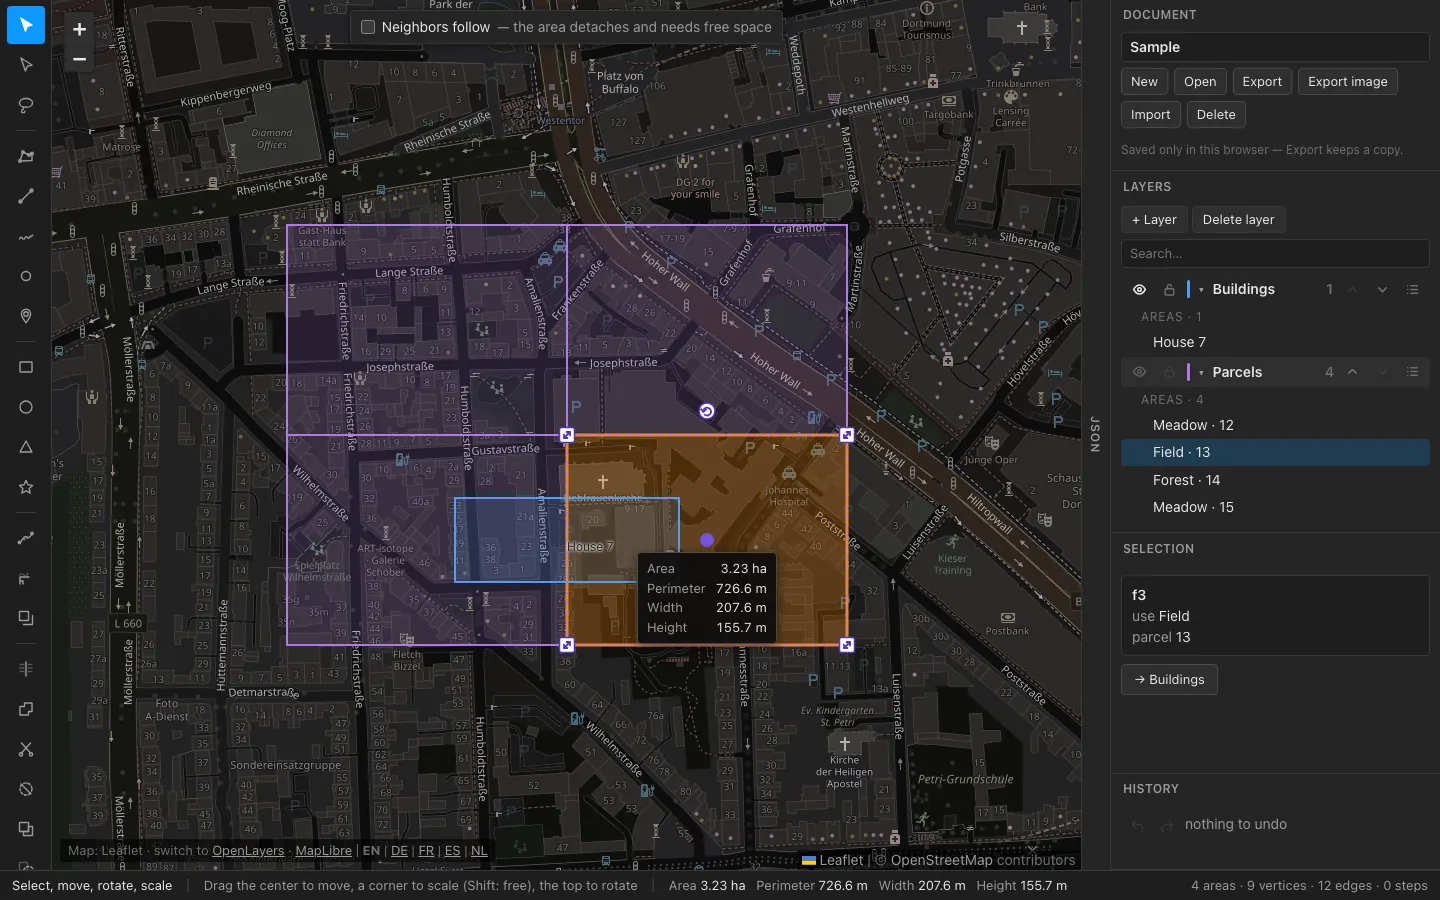
- In the editor on the Leaflet map, the toolbar with draw, split, merge, and cut is on the left, and Document, Layers, Selection, and History are on the right.
- Select an area and handles appear for moving, scaling, and rotating, along with its measurements.
- The status bar counts areas, vertices, and edges. At the bottom, you switch the map library and the language.
Docs
The docs
- The docs explain why the data stays topologically clean: the editor stores the map as a division into areas, and each border exists only once.
- The packages are called @vectorstream/*, and the core package holds the model, the check, and the GeoJSON import and export.
- A note in the docs says the packages are not on npm yet. There is one guide each for Leaflet, OpenLayers, and MapLibre.
Industries
The page for cadastre and land registry
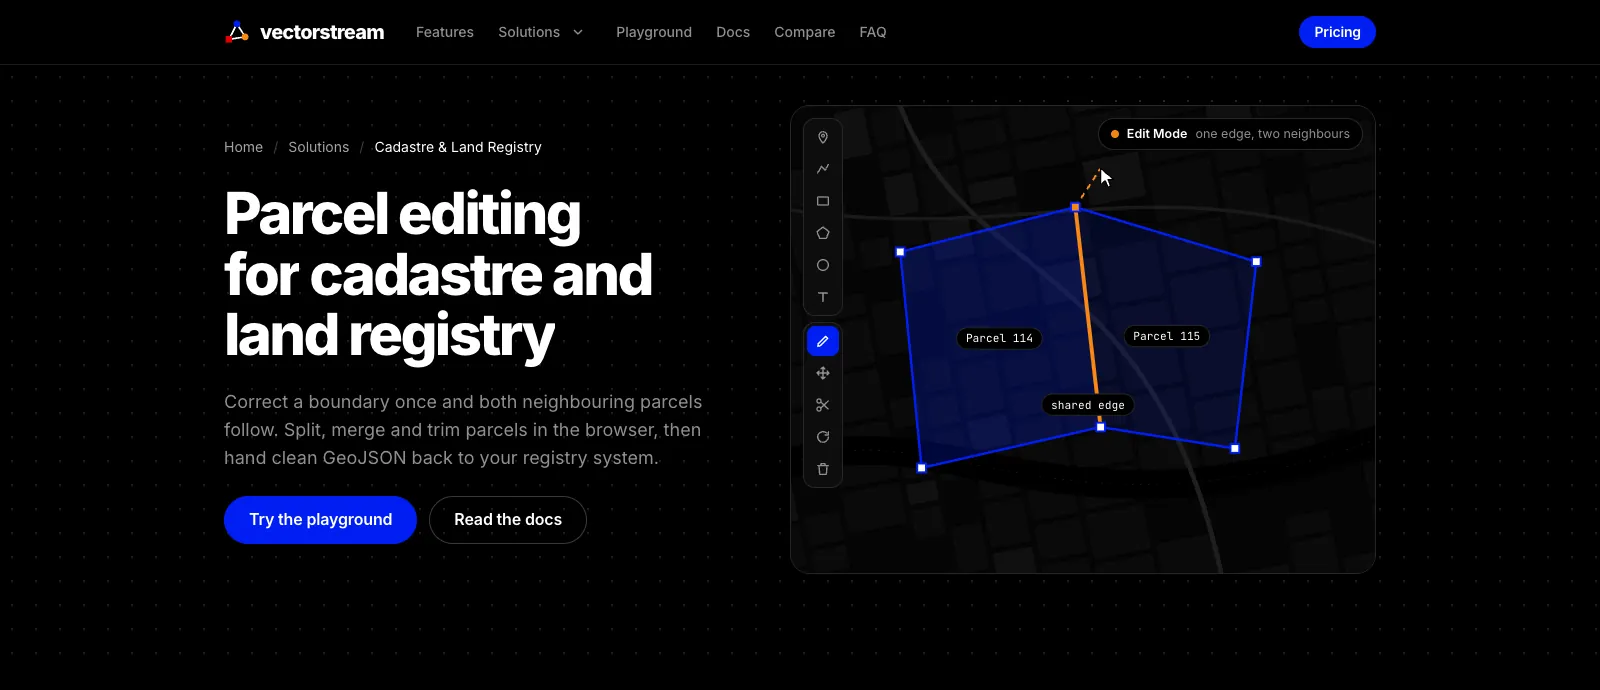
- The product has its own pages for individual industries. I show the one for cadastre and land registry here: it demonstrates how parcels can be edited.
- Correct a shared border once and both neighboring parcels follow. Splitting, merging, and trimming parcels works directly in the browser.
- The export delivers GeoJSON for the registry system. Other pages cover urban planning, forestry, and drone zones, for example.
The feature animations
On the product site, every tool has a small animation. I play four of them here in a loop. With reduced motion, a still frame appears instead.
PolygonsYou click corner by corner and close the ring. 
SnappingA new point snaps onto a nearby corner or edge. 
Shared bordersNeighboring areas share a border, so one drag changes both areas. 
Merge areasMerge turns areas with a shared edge into a single area.


