
All case studies
Bricklimit
Overview

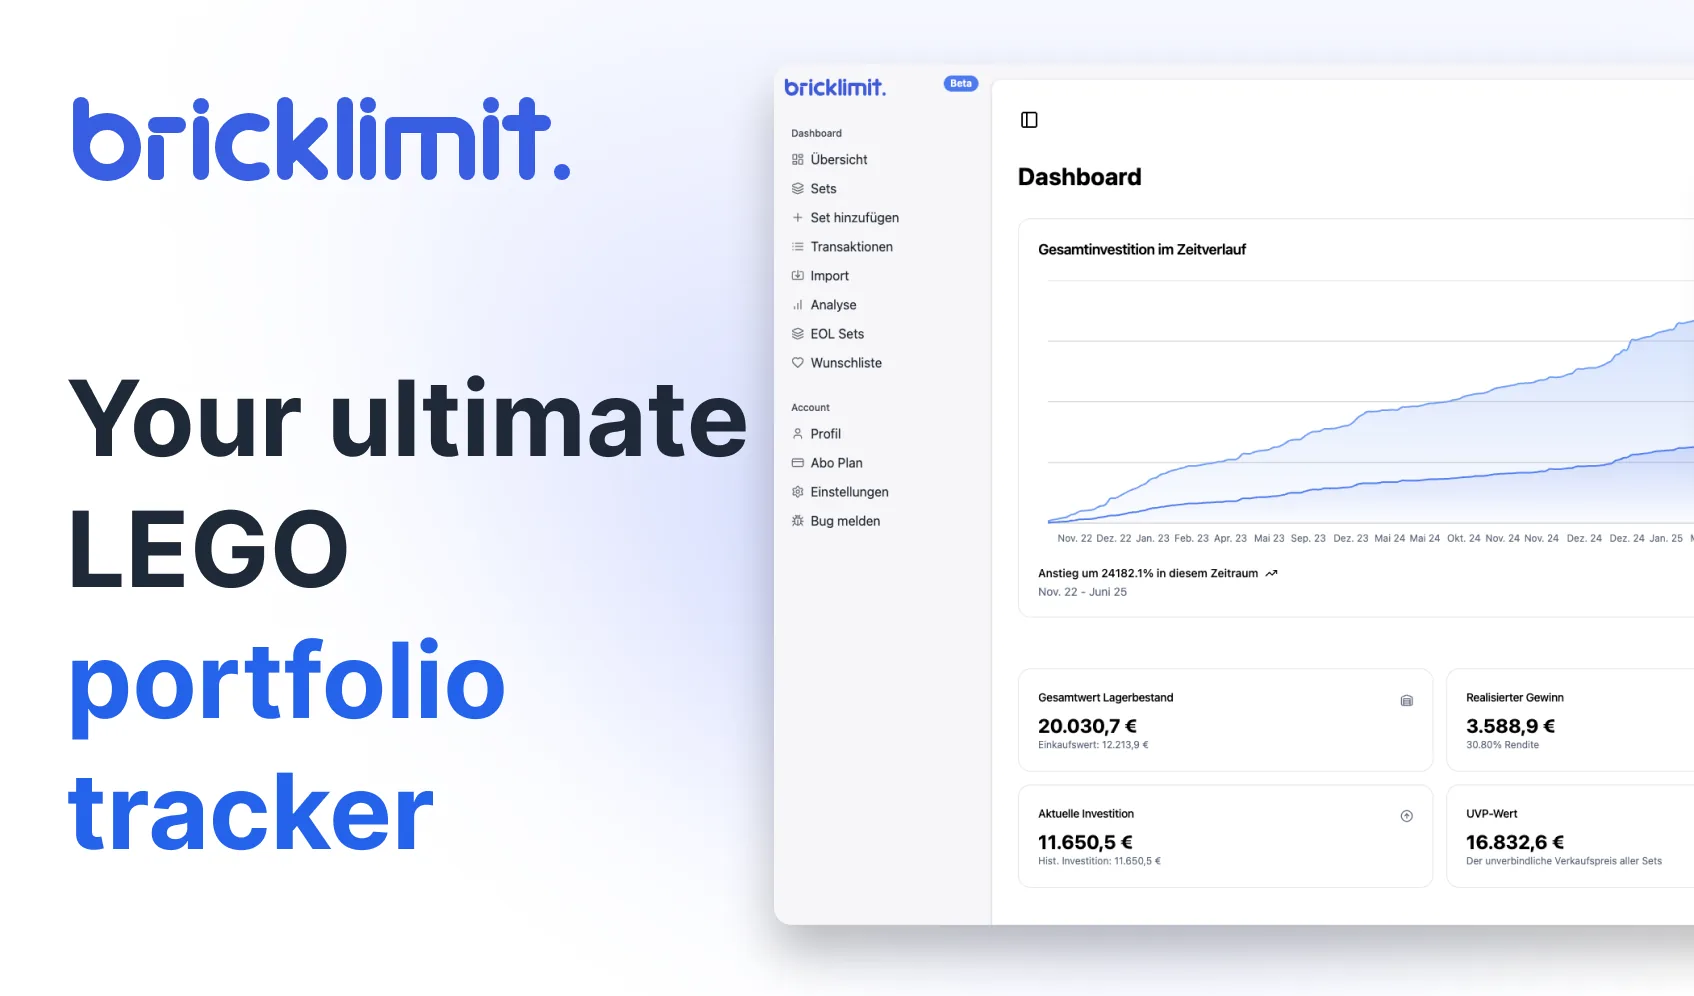
Bricklimit is a portfolio tracker for LEGO. I built it with the help of AI. Collectors manage their sets and transactions in it. The dashboard shows the value of the portfolio and the course of the investment. It also has import, analysis, EOL sets, and a wish list.
- Type
- Web app and portfolio tracker
- Role
- Product, design, and build with AI
Project snapshot
Goal
Collectors want to manage their sets, transactions, and analyses in one place. There they see the value of their portfolio.
Outcome
Bricklimit runs as a web app. It offers a dashboard, set management, import, analysis, EOL sets, and a wish list.
AI in use
Task of the AI
- We use AI to categorize LEGO sets.
- For this, the AI uses the transactions from the invoices.
What went wrong
- The AI often assigned wrong prices.
- The AI often assigned wrong categories.
What we changed
- We then trained the AI with invoices.
- This is meant to increase the reliability of the AI.
The product
Dashboard
Set details
Import
Analysis
EOL sets
Wish list
Dashboard
The dashboard
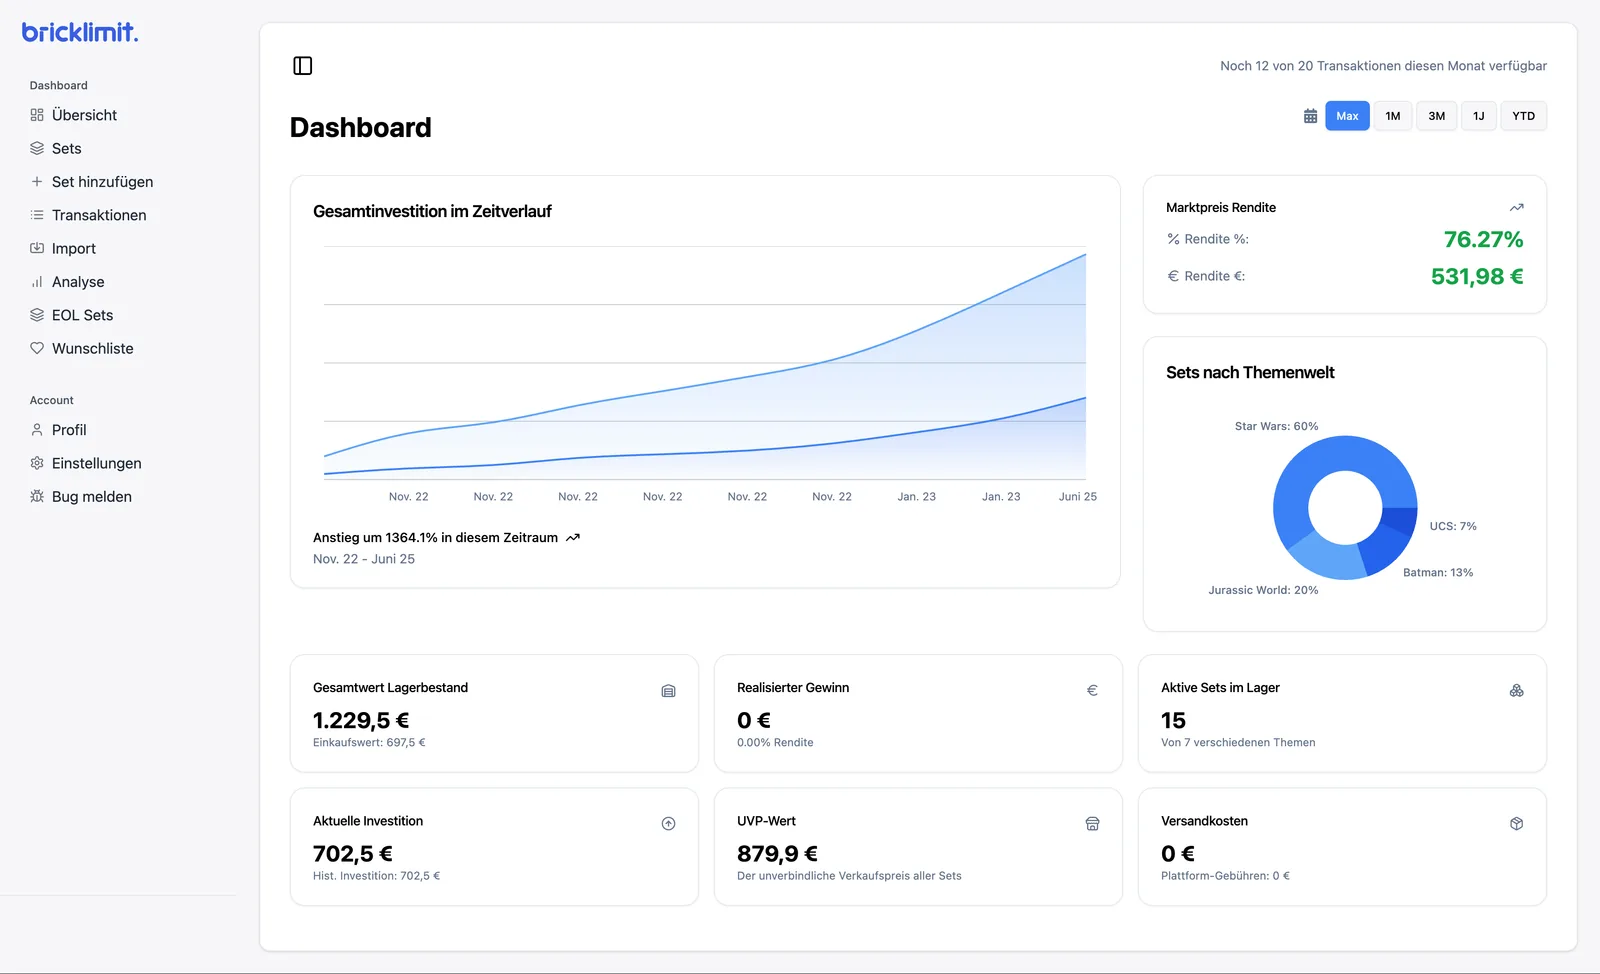
- The dashboard shows the portfolio at a glance.
- The menu leads to sets, transactions, import, analysis, EOL sets, and wish list.
- An area chart shows the total investment over time.
- Buttons select the period, for example 1M, 3M, or 1Y.
- A ring shows the sets by theme.
- Tiles show the total value, purchase value, RRP value, and shipping costs.
Note on the images
- The numbers in the images show only the interface of the app.
- They are neither a forecast nor investment advice.
- LEGO is a trademark of the LEGO Group.
- The set names and set images shown belong to their owners.
Sets
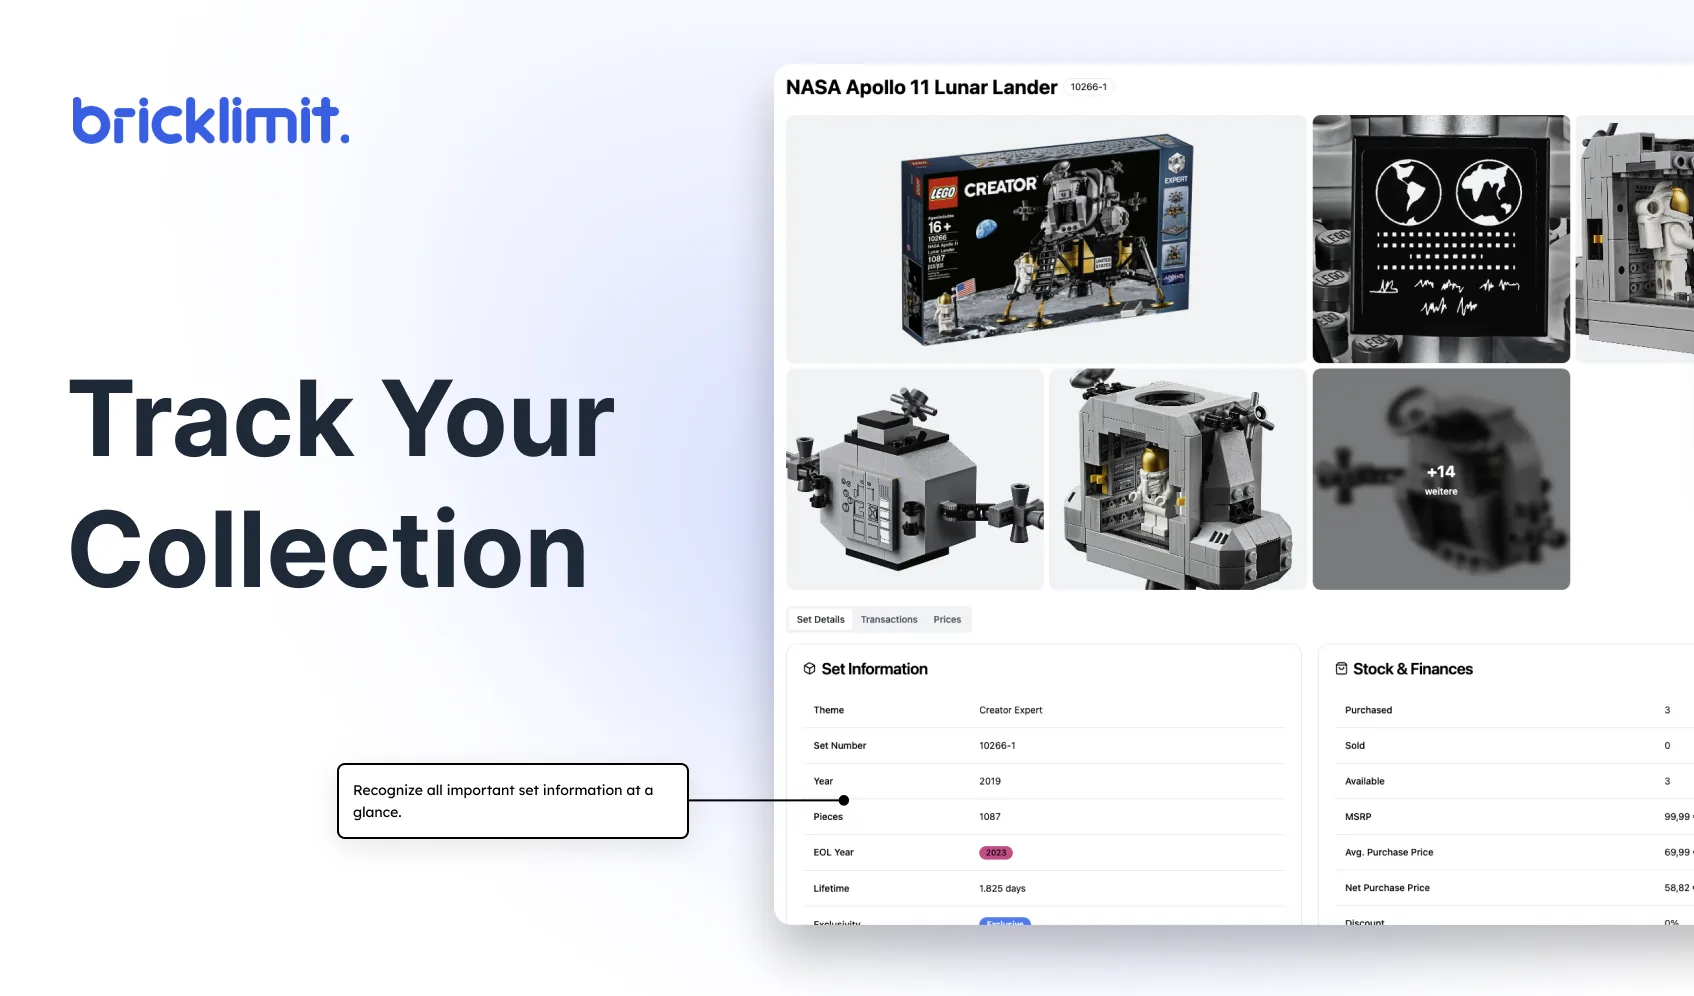
Details per set
- Each set has its own page with images.
- The tabs are set details, transactions, and prices.
- The set information names the theme, set number, year, parts, EOL year, and lifetime.
- The area inventory and finances names the sets bought, sold, and available.
- It also names the RRP and the purchase prices.
Import
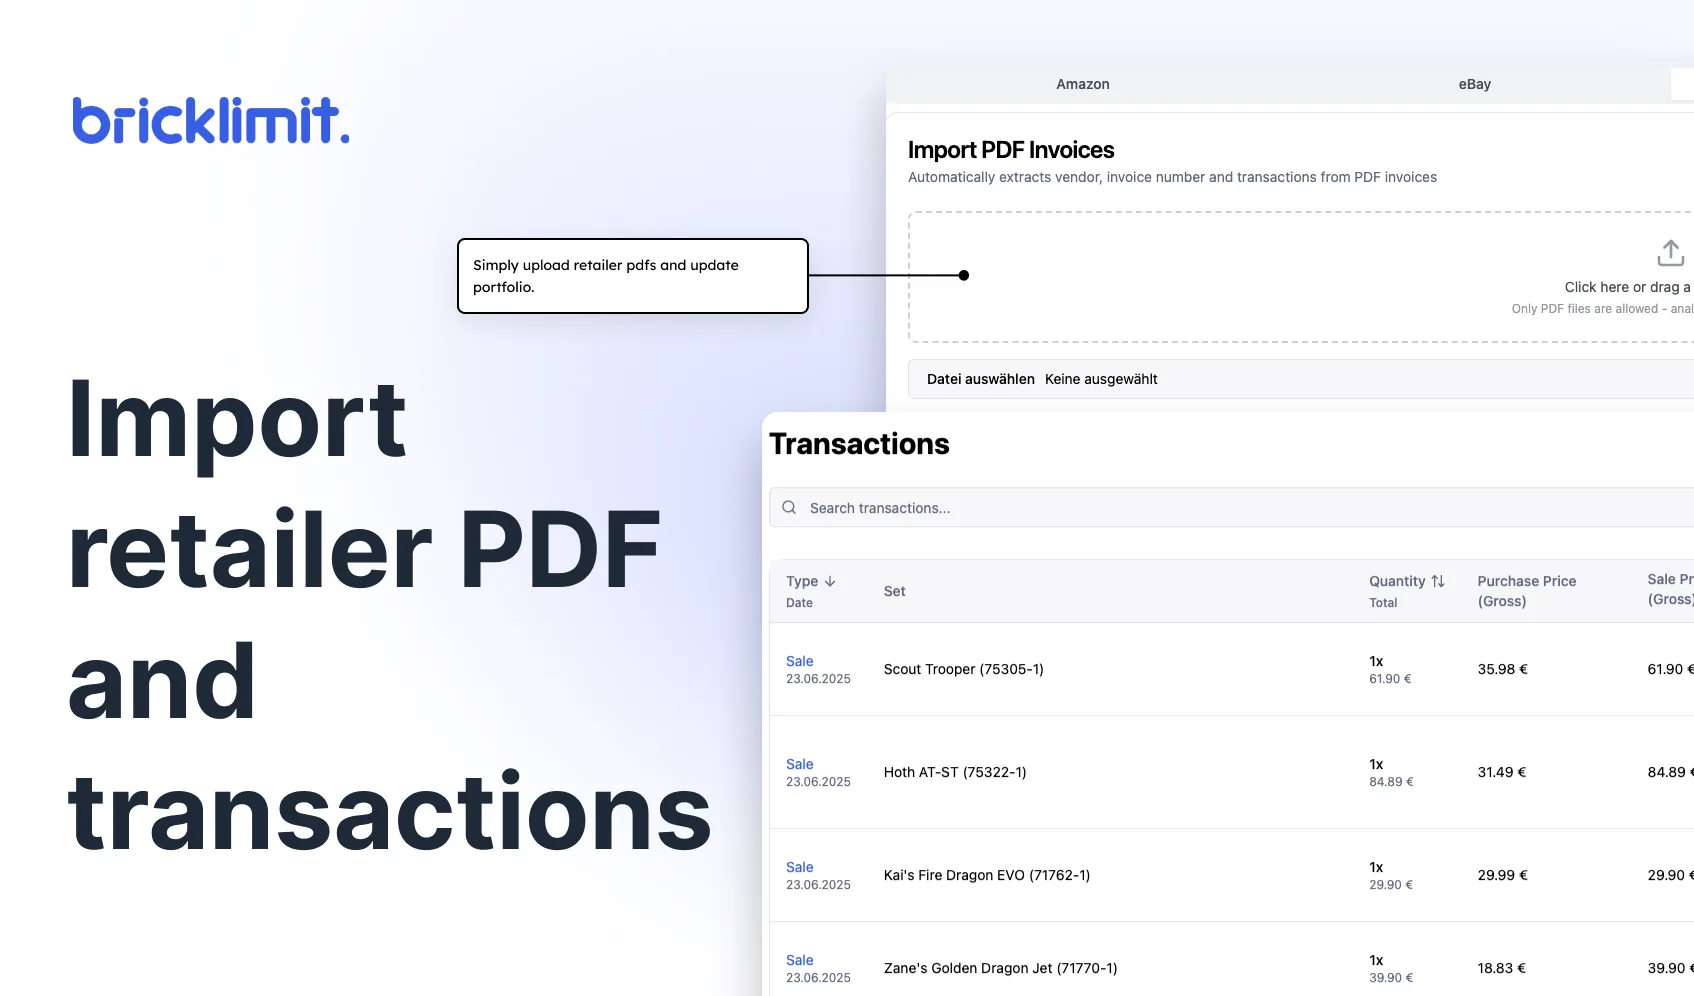
Import purchases
- The import reads PDF invoices from retailers.
- It recognizes the retailer, the invoice number, and the transactions.
- Transactions from Amazon and eBay can also be imported.
- The transaction list is searchable.
Analysis
Evaluate the portfolio
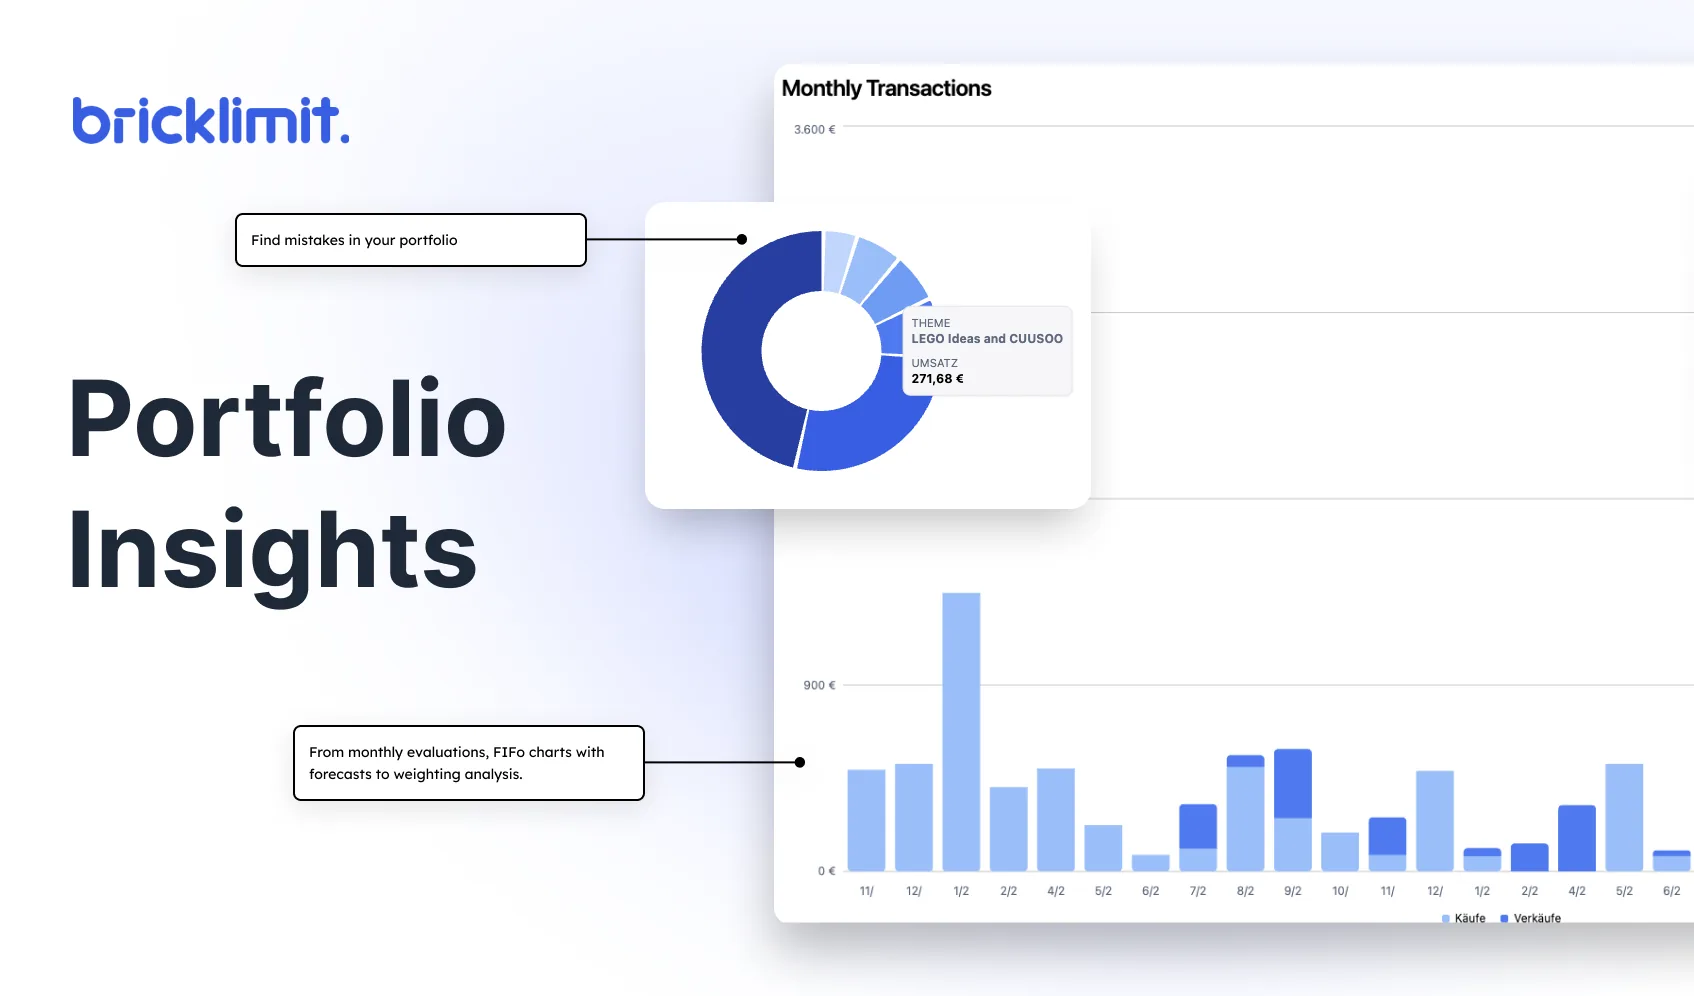
- A column chart shows purchases and sales per month.
- A ring shows the revenue per theme.
- According to the product graphic, the analysis ranges from monthly evaluations through FIFO charts to weighting analysis.
- According to the product graphic, it helps to find errors in the portfolio.
EOL sets
Expiring sets
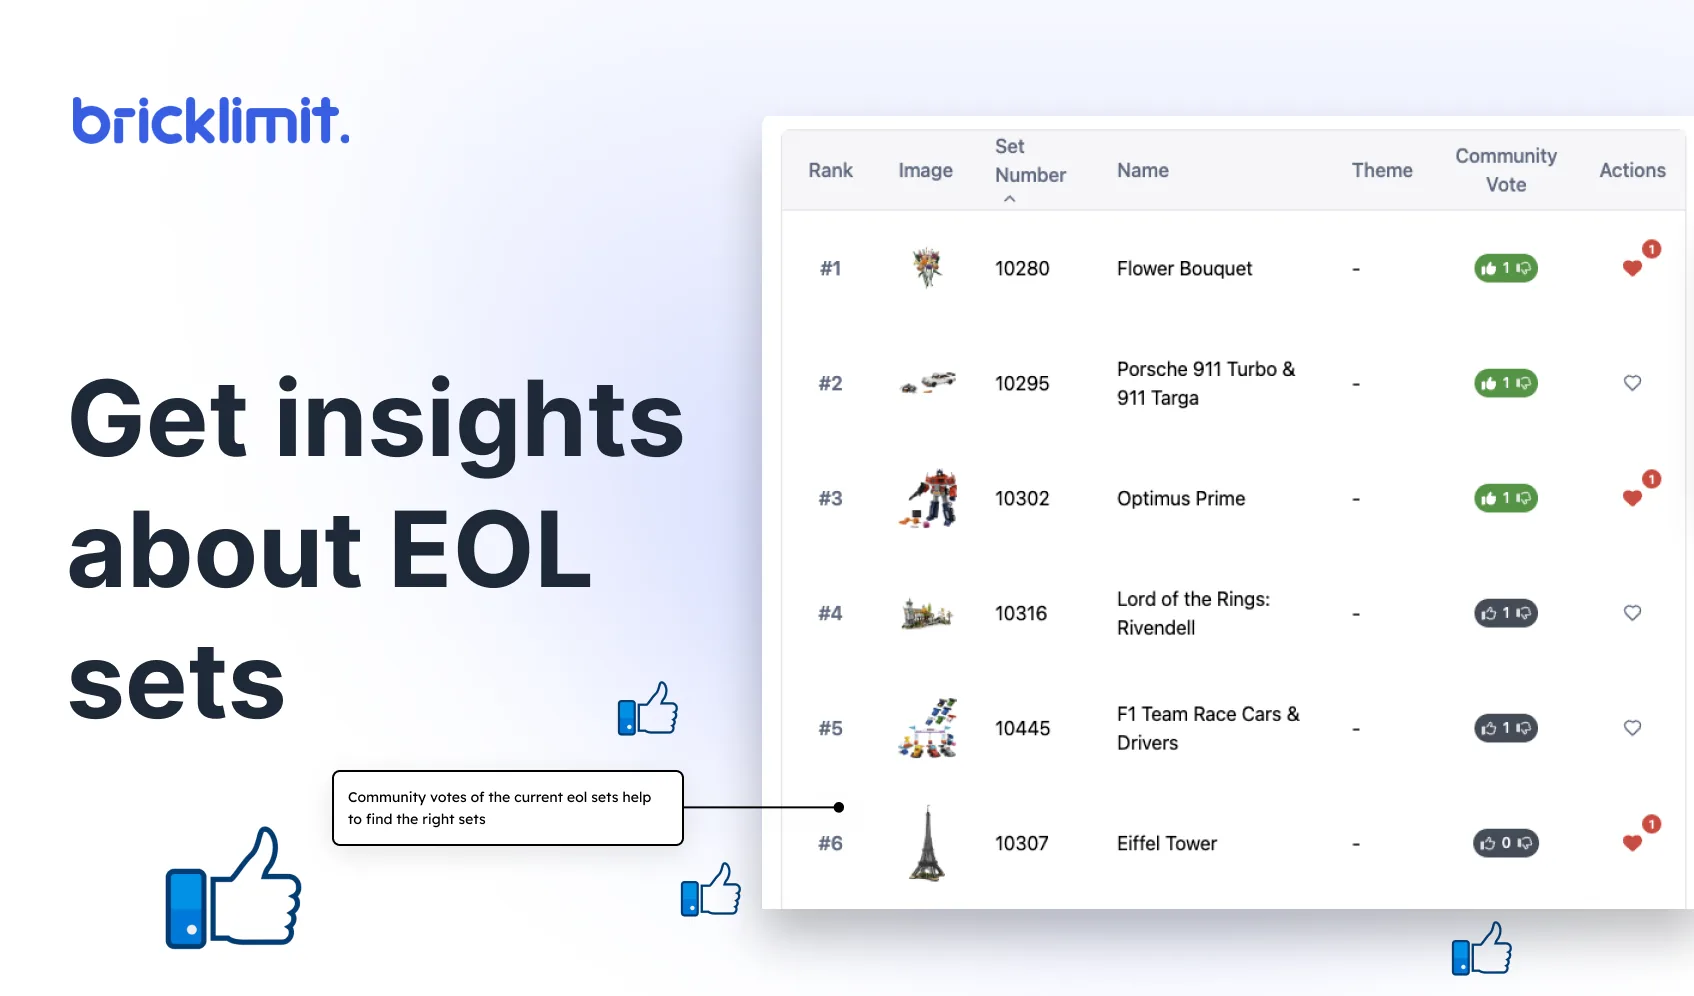
- EOL sets are sets that leave the product range.
- A ranking list names set number, name, theme, and community votes.
- According to the product graphic, the votes help to find the right sets.
Wish list
Bookmark sets
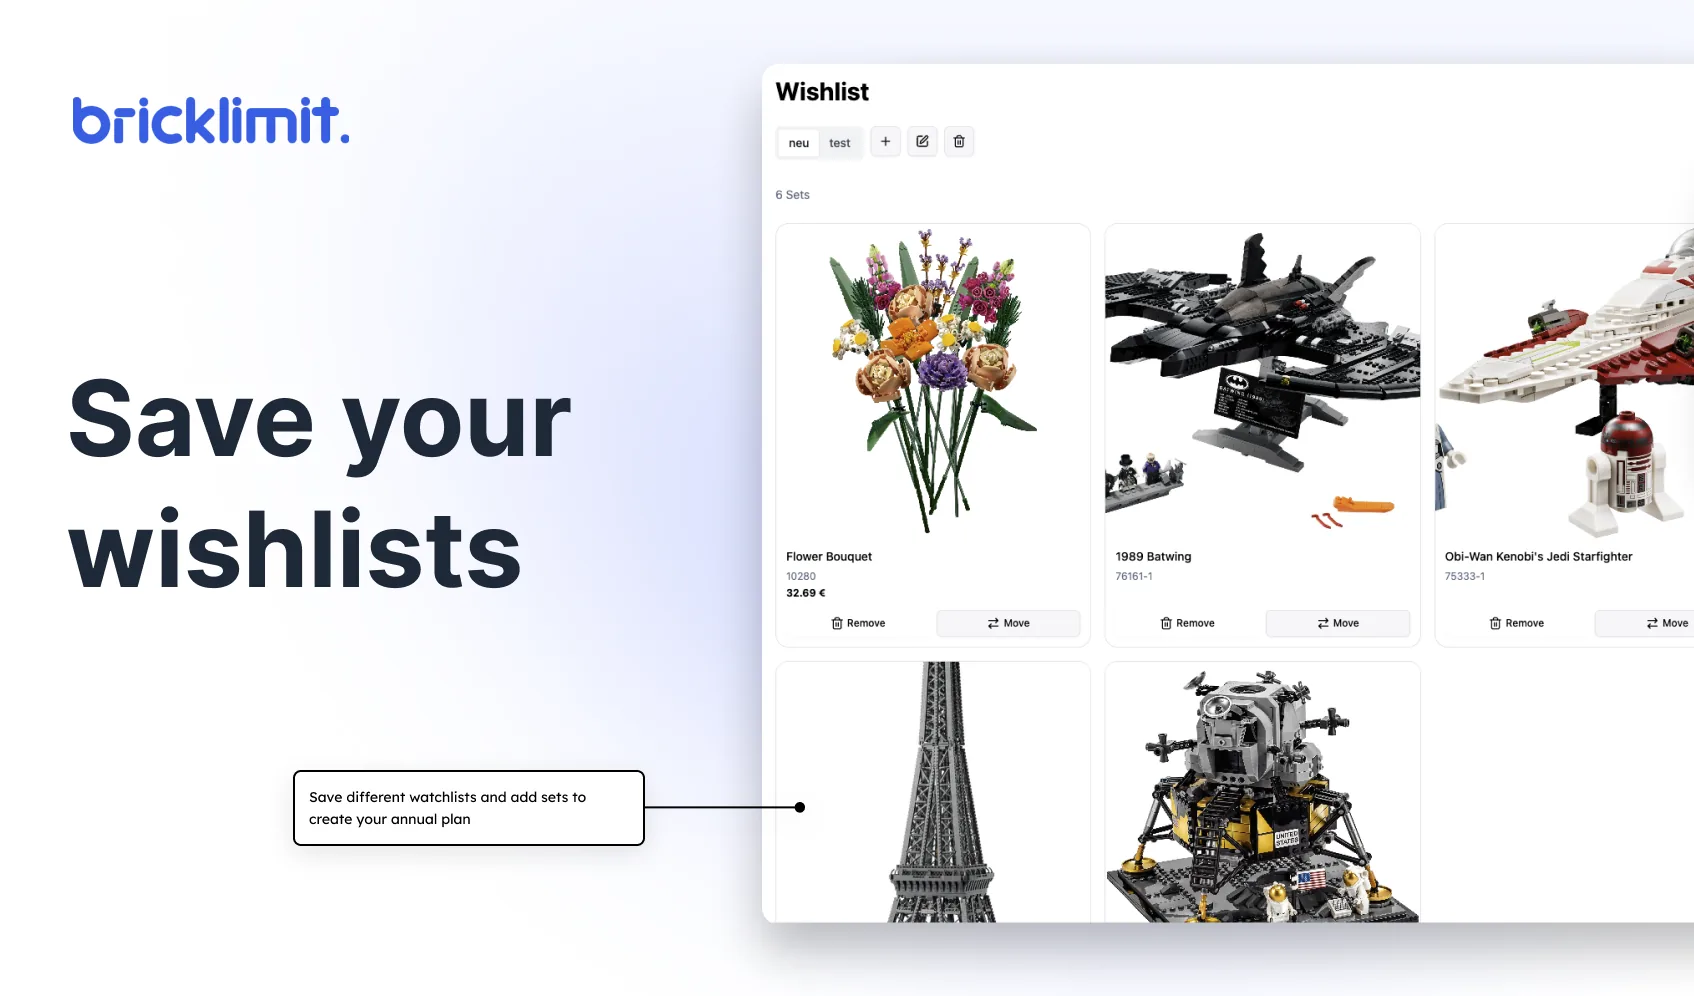
- The wish list collects sets that a collector wants to buy later.
- Several lists are possible.
- Each card shows the image, name, and set number.
- Two buttons remove a set or move it to another list.